
Chicago has the hardest 2026 NFL schedule and Cleveland the easiest when the comparison uses opponents' 2025 regular-season records. Chicago's opponent percentage is .550; Cleveland's is .429. Those are historical inputs, not predictions of the 2026 season.
Different methods can produce different answers. This guide explains the published historical leaders, shows how the calculation handles repeat opponents and ties, and compares that approach with projected-win rankings. It also uses official 2026 fixtures to show why rest and travel deserve a separate look. Sources and schedules were checked on October 11, 2026; future kickoff details should be rechecked nearer the game.
Who has the hardest and easiest 2026 schedule by last year's records?
Chicago has the hardest 2026 NFL schedule and Cleveland the easiest when the measure is opponents' combined 2025 winning percentage. The Bears' benchmark is .550; the Browns' is .429. These are historical opponent-record measurements, not forecasts of either team's 2026 wins and not an updated ranking of only the games remaining in October.
The Giants' May 14 official schedule analysis publishes the league table. Here are the two ends of that specific ranking, with tied places preserved. In this table, No. 1 means hardest.
| Hardest end | Rank | Opponents' 2025 win percentage |
|---|---|---|
| Bears | 1 | .550 |
| Dolphins | 2 | .542 |
| Cardinals | T3 | .538 |
| Packers | T3 | .538 |
| Chiefs | 5 | .536 |
| Easiest end | Rank in the same hardest-first table | Opponents' 2025 win percentage |
|---|---|---|
| Browns | 32 | .429 |
| Saints | 31 | .434 |
| Bengals | 30 | .450 |
| Falcons | T28 | .465 |
| Colts | T28 | .465 |
“Easiest” describes a comparison with the other schedules under this method. It does not mean a team faces easy games every week, nor that its own offense or defense is strong enough to exploit them. The calculation looks at the opposition's records and does not award the home team any wins.
Imagine two fans debating a matchup. One points to the visitor's difficult season-long schedule; the other points to an injury in the home offensive line. The schedule figure supplies broad context, while the availability information belongs to the particular game. You can consider both without asking one number to answer every question.
A full-season average also hides the order of the opponents. A team might encounter its toughest games early and a more manageable sequence later. Another might have the same average with the demanding portion still ahead. The season-long label alone cannot tell you which fan should feel more comfortable about the next month.
The benchmark remains useful because its inputs are understandable and fixed. You can compare schedules using the same completed season instead of treating a publisher's unexplained opinion as a fact. Just keep the year attached: these percentages describe what the scheduled opponents did in 2025, even when you read the table during 2026.
Start with your club in the NFL team schedules and look at the actual upcoming opponents. The ranking gives you a reason to inspect a sequence, not a reason to stop inspecting it. That distinction makes the headline more helpful whether you are following a division race, planning which games to watch or assessing a fantasy matchup.
How opponent winning percentage is calculated
The basic calculation combines the previous season's records of the teams on a club's schedule. Add the opponents' wins, losses and ties across every scheduled matchup, then divide the adjusted wins by the total games in those records. For this 2026 preseason comparison, the records belong to the 2025 regular season.
Opponent winning percentage = (opponent wins + half of opponent ties) ÷ (opponent wins + opponent losses + opponent ties). Keep the season label beside that formula. Substituting current 2026 results produces a different comparison and should get a new label.
Count repeated opponents as separate games
Start with the actual game list, rather than a list of different team names. The NFL's schedule formula gives a club six divisional games: two against each of its three division rivals. Those return meetings matter because a difficult opponent occupies two places on the calendar.
In the standard 17-game schedule, those three rivals each appear twice, with 11 other opponents appearing once. That gives 17 game slots and 14 different opponents. Counting each rival just once would underweight the division and answer a different question: how strong is the collection of distinct teams?
Imagine a fictional opponent that finished 12–5. If your club plays that opponent twice, enter 24 wins and 10 losses into the combined calculation. A fictional 5–12 opponent appearing twice contributes 10 wins and 24 losses. Neither adjustment predicts the result of the two new meetings; it simply gives each scheduled game its proper place in the historical comparison.
This is especially useful when checking a spreadsheet. Put one opponent on each fixture row, include its 2025 record, and keep both home and away divisional meetings. A total of 14 rows is a warning that the return fixtures may have disappeared. The schedule should contain 17 regular-season rows before you add the records.
Treat ties and rounding consistently
The NFL's official tie procedures count a tied result as half a win and half a loss. Apply that treatment before rounding the final percentage.
Here is a fictional worked example, unrelated to any team's actual 2026 ranking. Suppose the 17 opponent rows contain a combined 145 wins, 142 losses and two ties. Those entries total 289 games. The adjusted win total is 145 + 1 = 146, so the calculation is 146 ÷ 289 = 0.505190…, displayed as .505 to three decimal places.
Keep the unrounded value for comparisons. Two clubs can display the same three-digit percentage while differing slightly underneath it. Conversely, a published table can deliberately list a tied rank. Preserve the source's displayed ties instead of inventing a new order from alphabetical team names.
When another site's number differs, first check the year, treatment of ties and repeated opponents. Next check whether it includes preseason or postseason games. A historical regular-season comparison should not quietly mix those records into the total. Only after those checks is it useful to compare the arithmetic itself.
Why projected-win rankings can give a different answer
A historical table asks, “How did these opponents perform last year?” A projection asks, “How strong do we expect these opponents to be this year?” Those are useful but different questions. A team that changed its quarterback or coaching staff may look different in a forecast before it has played its first game.
Detroit provides a clear 2026 example. The Lions' May 14 schedule breakdown lists their slate as the sixth easiest using 2025 opponent records, with a .467 percentage. Sharp Football Analysis's September publication, using projected win totals instead, places Detroit first from easiest to hardest and Arizona last.
That difference does not mean Detroit received a new set of opponents. It means the comparison changed its inputs. Neither figure establishes that the Lions will win a particular matchup, and neither is a fresh October 11 price for a game or season-long wager.
Think of a fictional opponent that finished with a losing record but is expected to improve. Its old record still contributes a low historical percentage. A new projection can make that same scheduled game look tougher. An opponent expected to decline can move in the opposite direction. The calendar remains the same while the evaluation changes.
Check the method, date and ranking direction
Before arguing that two rankings disagree, read their labels. Sharp's table makes No. 1 the easiest and No. 32 the hardest. The historical table above makes No. 1 the hardest. A quick glance at the rank number can therefore reverse the meaning.
Keep four details beside any number you save: the season being evaluated, the input or model, the reference date and the direction of the ranking. “Detroit, first” leaves all four questions unresolved. “Detroit, easiest in Sharp's September projected-win comparison for 2026” gives another fan enough information to understand the claim.
A column showing a club's own projected wins also needs care. That is a forecast of the club's season, rather than its opponents' combined historical percentage. It cannot be substituted into the .550-style comparison above. Check the column heading before treating a decimal or a ranking as the same statistic.
For a specific game, move from the season-level summary to the actual opponent. Check the venue, current available players and recent performance. A favorable overall calendar can still contain a difficult individual meeting; a difficult calendar can still contain a promising spot. The model helps you frame those questions, while the fixture provides the details needed to answer them.
Rest and travel can change the feel of the same schedule
A season's opponent percentage does not tell you when the games happen. Two comparable opponents can feel different if one arrives after your team's bye and the other comes during a busy run of games. Keep the calendar beside the strength ranking so that those differences remain visible.
Compare both teams' previous games
For a rest comparison, record each club's previous kickoff and the next shared kickoff. Check both teams, rather than assuming a Thursday appearance gives one side a disadvantage. They may both be turning around from Sunday, or one may have a longer break.
Detroit's official schedule gives a useful busy stretch: New England in Munich on November 15, Tampa Bay at home on November 22 and Chicago at home on Thanksgiving, November 26. That is three scheduled games across 12 calendar dates, with international travel in the sequence.
Mark that stretch when planning what to watch, but do not turn it into an automatic loss prediction. The dates show a compressed calendar. They do not establish future injuries, how well the team will recover or how its opponent will play. A fair matchup comparison still needs the other club's preceding game and current information nearer kickoff.
Mark international travel without assuming a loss
Jacksonville's published calendar has Philadelphia at Tottenham on October 11 and Houston at Wembley on October 18, followed by the Week 7 bye. The Jaguars then host Indianapolis on November 1. Those are two London fixtures before a scheduled week without a game.
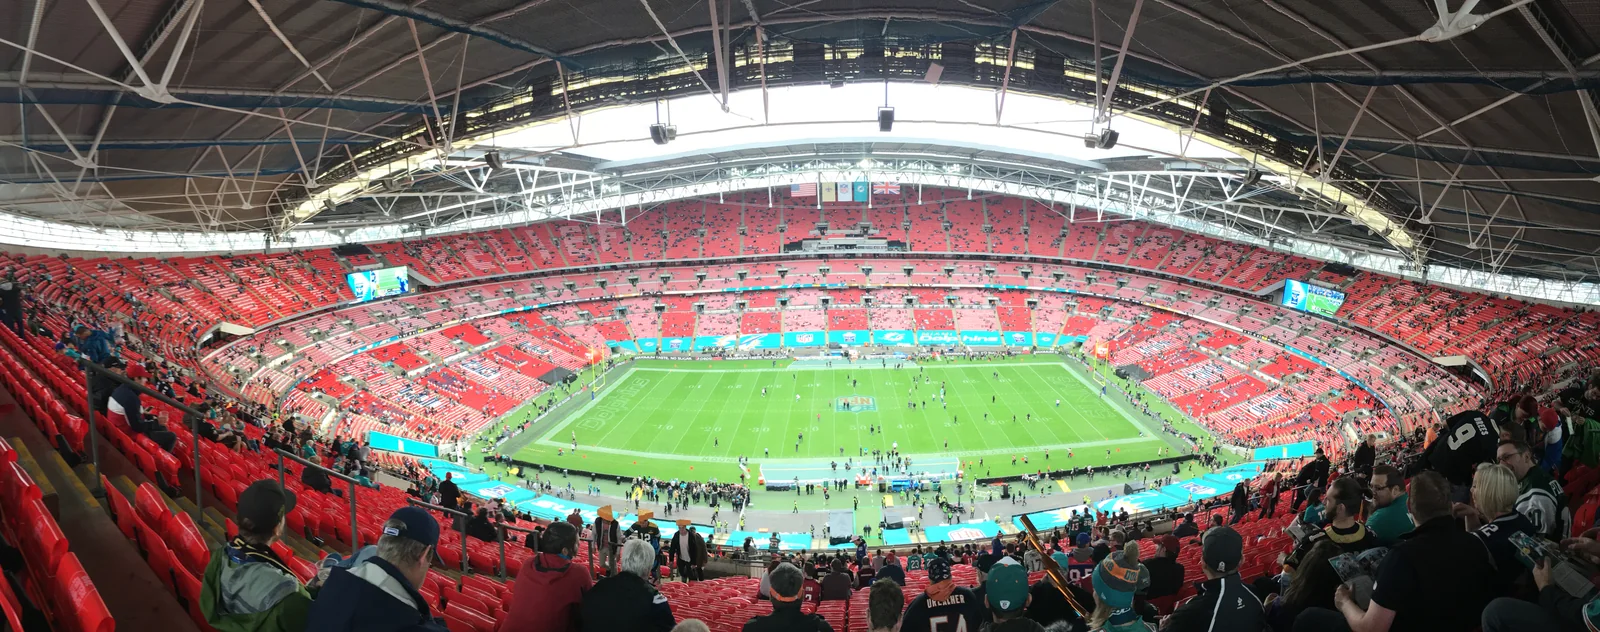

The useful comparison is the sequence of venues and the break afterward. Simply counting two overseas appearances misses that context. Equally, the fixture list alone does not confirm the team's precise travel itinerary, accommodation or training arrangements. Avoid treating a guess about those plans as a measured travel burden.
For fans, international games also change the viewing routine. Check the published kickoff in your time zone before arranging the day. That practical adjustment is separate from predicting whether a club will play better or worse overseas.
Check the bye and the next kickoff together
A bye does not guarantee a return on Sunday. Green Bay's official release places its Week 11 bye before the Wednesday, November 25 game at the Rams, scheduled for 8 p.m. ET. Calling that a three-day turnaround from Sunday would invent a Packers game during their bye.
That is different from Green Bay's October 25 game at Detroit followed by its October 29 home meeting with Carolina. The previous actual fixture matters more than the name of the next weekday.
Use the NFL bye-week calendar to mark the break, then open the surrounding fixtures. Note where the club last played, where it returns and the time until its next game. This gives you a concrete schedule note without pretending that rest alone determines the winner.
Use schedule strength for the games still ahead
Once the season has started, a full-season preseason ranking answers a broader question than the one most fans are asking: “What does my team face next?” Games already played remain in the original 17-game comparison. Removing them changes the set of opponents being measured.
A club can therefore have a difficult full-season schedule and a more manageable remaining stretch, or the reverse. That is a statement about which fixtures remain, rather than a claim about any particular club's current ranking. This guide does not present a newly calculated, live remaining-schedule table.
To inspect your team's remaining games, start with its current fixture list and mark the games already completed. Keep any later divisional return meeting even if the clubs have already faced each other. Decide which opponent measure you want before adding the records: last year's performance, current results or an identified projection. Label the choice and date.
The NFL's schedule explanation separates setting the opponents from arranging the dates. Follow that same distinction when reading the calendar. Evaluate the opponents first, then make separate notes for venue, rest and travel. Combining everything into one unexplained “difficulty” number hides what you actually learned.
A printable NFL schedule can make the next few weeks easier to compare. On each remaining fixture, write the opponent, home or away, previous game date and next kickoff. Add a short reason for any matchup you want to watch closely. “Divisional return game after a short turnaround” is a clearer note than an unexplained red box.
Fantasy football needs another step. An opponent's overall win percentage does not describe every position matchup. Before making a lineup decision, consider the player's role, the relevant opposing unit and your league's scoring. A team-level strength ranking alone cannot tell you whether a receiver will get targets or a running back will keep his workload.
For picks, treat the schedule as context for the matchup. It does not replace current availability, the particular opponent or the line and price if you are comparing a spread. For watching, use it to identify interesting stretches and plan around different kickoff days. Those are practical uses that do not require pretending a season-level rank is a final score forecast.
Before sharing a hardest-or-easiest claim, check one last time: which season, which inputs, which date, which games and which ranking direction? If those details are clear, another fan can understand the comparison and decide whether it answers the question they had.
Cover photograph: Soldier Field during Bears–Vikings on Monday night, December 20, 2021, an archival interior scene rather than a 2026 game. Photo: Ryan Dickey, Wikimedia Commons source, CC BY 2.0; resized and converted to WebP.

Comments